Fishbowl Conference Notes
This is a post for attendees at Fishbowl Elevate 2022 conference.


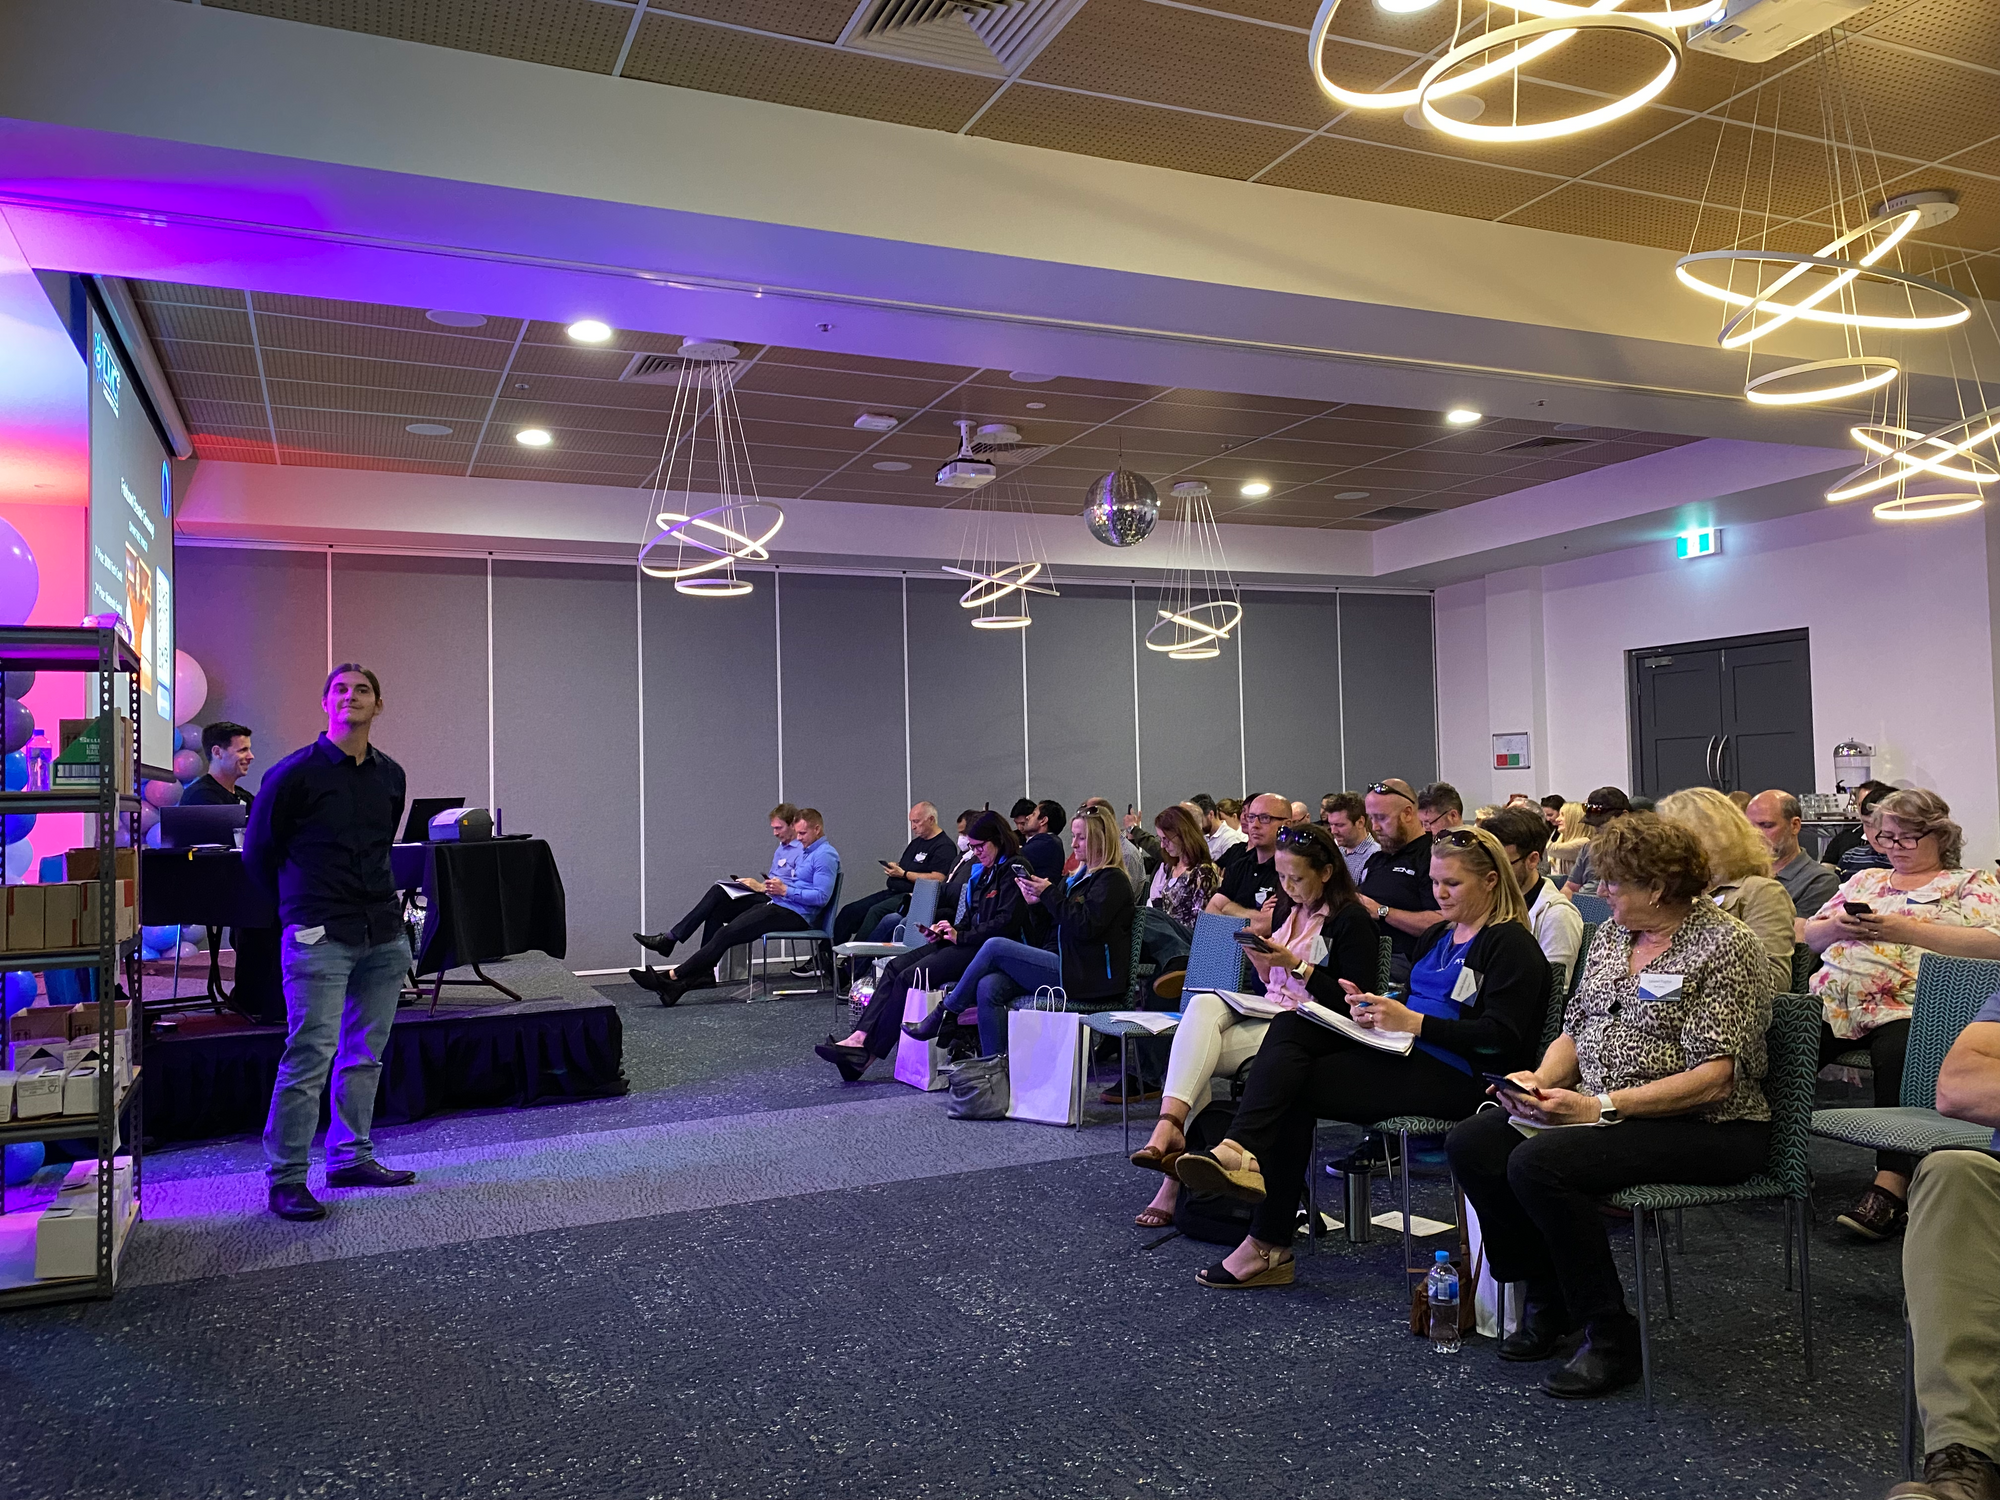
This is a post for the attendees of the Fishbowl Elevate 2022 conference, who saw Zac Harrington from Lucid Multi Cloud presenting on data reporting and "Fishbowl Reporting as a Service" today at the conference.
To briefly explain the relationship between LMC2 and Adrenalan - we provide the information and business process analytics for the LMC2 service offerings for Fishbowl. (As you can read about more on this website, Adrenalan specialises in helping you on your journey through information, identity and your business intent.)
So, let's get on and have a look at some Microsoft PowerBI views that Zac presented. These are views of your data that can be made available with the LMC2 reporting offering. (Please note these example reports are from some modified Fishbowl demo data.)
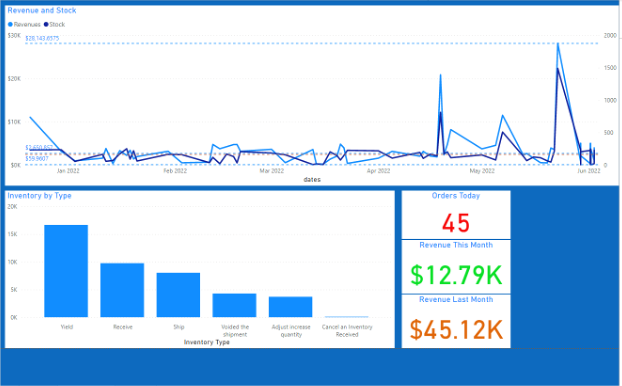
First up, we have a very high-level view of revenue.
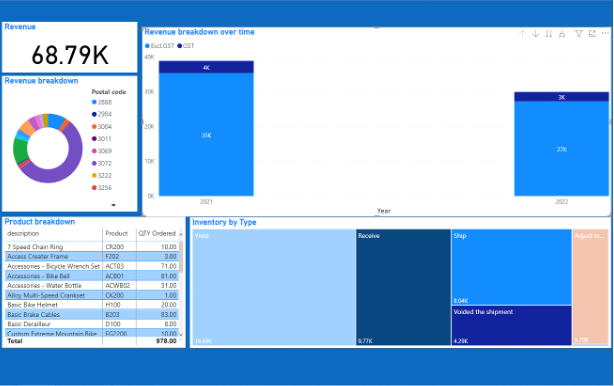
At the high-level, this view is showing you revenue and some breakdowns of that revenue - over time and by delivery area (by postcode).
Clicking on the year allows you to filter by the year - 2022 in this case.

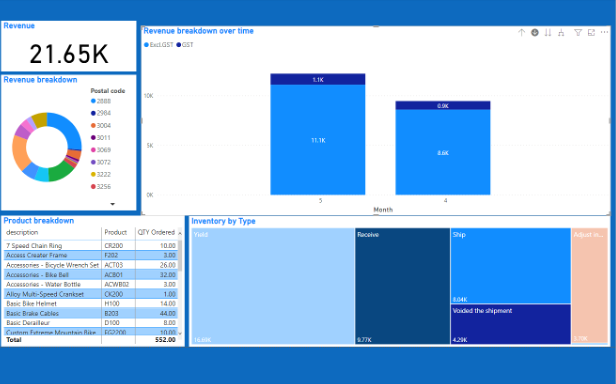
It's the same data. You can filter further, say 2022, Q1.
Maybe you just want to see a month... again, sorted by most revenue but now on a per-day basis.
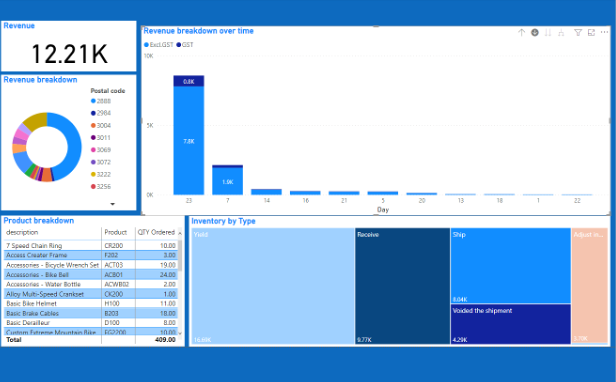
Nice - you get to see what you want to see, quickly zooming in on your data. We can also change the way you see the graphical data... maybe you want to check our your revenue vs stock, over time.
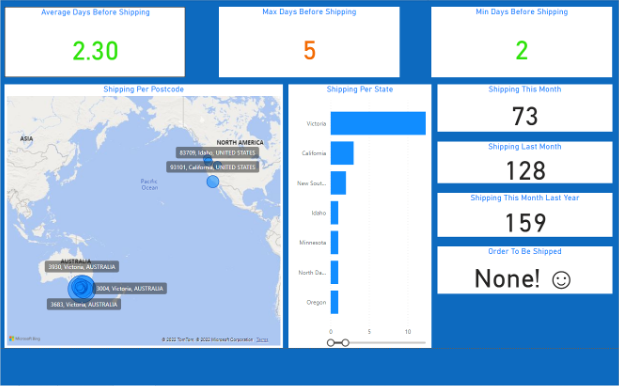
Why not check out where you're shipping to? It might give you a graphical idea of where your customers are... which could lead to warehouse optimisations and improved shipping processes - lower costs and faster delivery, why wouldn't you?
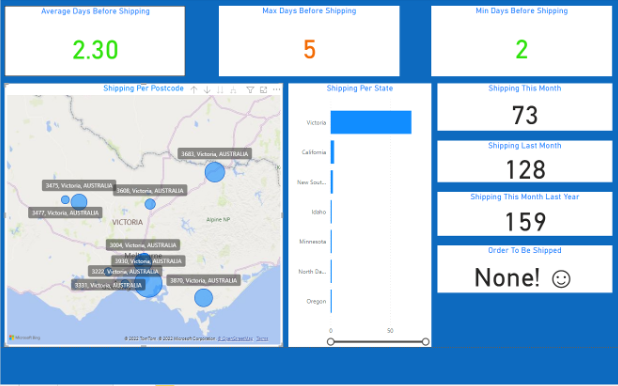
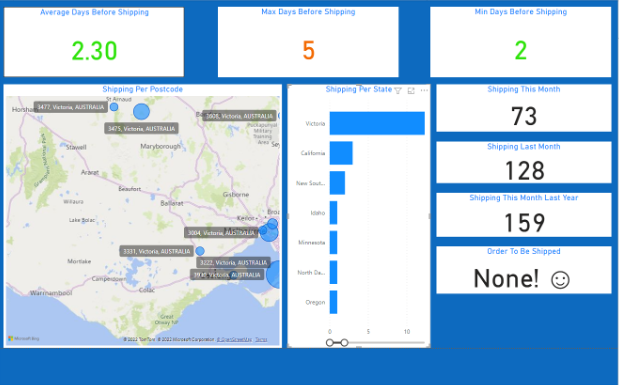
Maybe zoom in on just the Australian orders... (two different levels of zoom)
Now these views have all been using Microsoft's PowerBI. However if you want to build views without being beholden to Microsoft's cloud products (and licensing), you might want to use Grafana. Grafana can be hosted local to your database... and potentially other data you have in your business that you want to 'mix in' to create far more relevant dashboards for you.
So let's look at Grafana and we'll start with a view of revenue by postcode, inventory and some nice pretty graphs to go along with it.
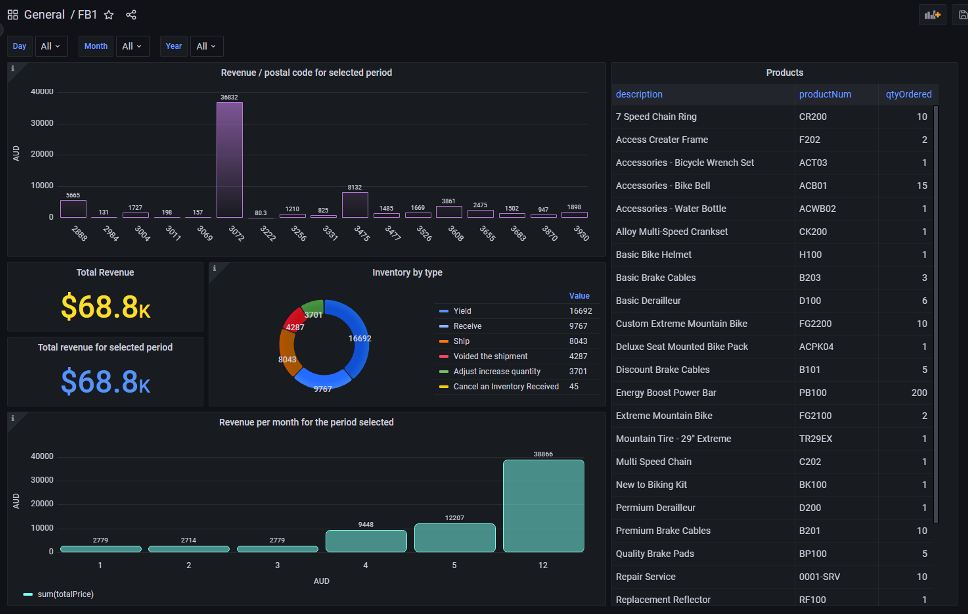
We can also build you 'drill down' screens and as many views as you need based on your Fishbowl and any other data you have in your business. This will help you visualise your metrics and KPIs... then you can look at optimisation and consolidation, as needed.
Which leads us back to an even higher level concept - the business processes that the tools (in this case, Fishbowl, with PowerBI or Grafana) support. If you follow the old adage "you can't improve upon it, if you can't measure it", mapping out your business processes, where Fishbowl supports those processes and the metrics around delivery of those processes will allow your business to figure out:
- How does your business process actually look? (Hint - if it's convoluted, there's almost no way it is optimised... and you'll likely have quality issues as well, leading to higher costs.)
- What are the metrics associated with the current process? E.g. how long does it take to do to each stage; or costs associated with each stage.
- Then you can map out where you need to improve those processes and raise quality. If you're gathering the metrics along the way, you'll be able to see improvements as they happen and quantify your return on investment.
Above, we've run through some demo data, using live demo views in PowerBI and Grafana. Obviously if we look at your data and what matters to you, we can make far more tailored dashboards for you to obtain a view on your business.
Get in touch if you want to have a conversation about how we can help you.